Telia Carrier Anticipates Capacity Demand for the New Normal
Best Practices Include: Sophisticated Modeling, Open-Source Software, and Forward-Thinking —
Stay-at-home orders resulting from the COVID-19 pandemic have had a significant impact on Internet traffic, highlighting the Internet’s essential role as a means for people to keep in touch with loved ones, and for some to continue working while practicing safe social distancing.
As the world’s largest Internet backbone provider, we dive deep into changing global network traffic patterns. For example, the following statistics resulted from changes in European traffic comparing the average of all Mondays in February 2020 (pre-shutdown) versus Monday the 23rd of March 2020 (during shutdown).
• Overall 50% traffic increase in the Internet backbone
• Video conferencing up 400%
• Peak traffic levels up 35%
• On average, traffic at points of presence (POPs) has grown by 20.5%; with 208% and -56% respectively marking the extremes and highlighting the regional differences.
InvisiLight® Solution for Deploying Fiber
April 2, 2022Go to Market Faster. Speed up Network Deployment
April 2, 2022Episode 10: Fiber Optic Closure Specs Explained…
April 1, 2022Food for Thought from Our 2022 ICT Visionaries
April 1, 2022Among a variety of interesting changes, US afternoons and the evenings in Europe now contribute significantly to each other’s peaks. Sunday evenings used to see weekly traffic peaks, and now the entire week looks more like a Sunday evening as seen in a Monday to Sunday weekly view. (See Figure 1.)
Figure 1. Weekly Seasonality Change
Of note, video conferencing traffic used to be such an insignificant portion of overall traffic that it was barely noticeable but it now makes up a definitive portion of the traffic. The largest increase comes before lunch, consistent with patterns expected when the typical meeting location is moved from conference rooms to online calls. (See Figure 2.)
Figure 2. Video Conferencing Growth
Despite lockdown measures stabilizing in Europe (as of this writing on 5.11.20), traffic is continuing to grow, albeit it at a lower rate, but still far more than normal monthly seasonality would suggest. Among many other traffic stats, changes brought about by society’s dramatically altered behaviors and their implications for Internet planning and build-outs are equally interesting. While there is no immediate concern about running out of capacity, at certain times of the day and in a few regions, we are inevitably pushing the limits in situations where outages occur concurrently.
While no one could have predicted the impact that the pandemic has had on our lives and on the network, the sophisticated modeling process that we use has kept us all connected, even during extraordinary events.
Planning for Excess
Internet Service Providers typically keep some amount of excess capacity in their systems, and plan build-outs at least 6 months ahead of anticipated demand for at least 2 reasons:
1. To more easily meet ever-increasing bandwidth demand growth.
2. The excess provides redundant failover routes and capacity for those times when links go down.
Even when using our modeling and forecasting tools, the build-out required to meet the "new normal" of people staying and working from home while using teleconferencing and other digital means of communication requires an unusual jump in capacity.
Our model cannot predict future changes in seasonal patterns or creative third-party routing interventions at a time when everyone’s scrambling for available capacity. Even if it could, network capacity would still require an extra round of build-out to adjust to the new normal. To get a historical perspective over the last year, Figure 3 depicts a view of the number of network build-outs currently being expedited by Telia Carrier for backbone purposes.
Figure 3. Backbone Build-Outs Per Month
Traffic Demand Modelling
For the purpose of actual capacity planning, we make use of a mix of home-grown software, commercial software and several open-source projects such as Facebook, Prophet, and pmacct. The open-source projects are described below.
• Prophet is a procedure for forecasting time series data based on a model where non-linear trends are fit with yearly, weekly, and daily, seasonality plus holiday effects. It works best with time series data that have strong seasonal effects and several seasons of historical data. But Prophet also works well with missing data and shifts in the trend, so it handles outliers well.
• Pmacct is a small set of multi-purpose passive network monitoring tools that can account, classify, aggregate, replicate, and export, forwarding-plane data, control-plane data, and infrastructure data. How it maps into a wider context and flow can be seen in Figure 4.
Figure 4. High Level Capacity Planning Software Stack & Flow
Recognizing there are some situations and circumstances in which Prophet is not the perfect tool for forecasting, it still offsets much of the complexity associated with conventional autoregressive integrated moving average (ARIMA) models. If not for the simplification delivered via Prophet then the end user, in this case a network planner or engineer, would practically need to be a full-blown data scientist to understand which knobs to adjust to decompose any given time series data.
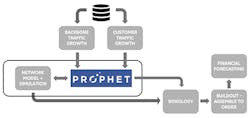
At a high level, the overall model takes pre-structured and time stamped data about the network as input. The data is enriched and linked to be aggregable into any given view and dimension the consumer wishes. At this stage of the process, all computations and analysis are performed – which in turn becomes the foundation of which all forecasting is based on. Because both the technical and commercial artifacts of each component are modelled, it provides a robust output on how both capital and operational expenditures will be impacted over time and location (per device, POP, and/or region).
In a year’s time, and through executing well ahead of time based on the forecast, it has also enabled the reduction of our customer orders requiring build-out by 40%, with the trend poised to continue throughout 2020. Thus, we stay ahead of trend, and do not have to have infrastructure/underlay crews scramble at the last minute to add capacity.
Fully Utilized Capacity — The "New Normal" Is Not Normal
The recent dialogue seems to revolve around how networks cope in a fully operational state. This is not typically what they are built for in the first place, thus making for an equally poor metric now for us to utilize.
What is more useful is understanding whether the network can cope during outages, with the most common one being able to handle any single failure. We model and measure this for every hour of the day in 3 different setups.
FIRST is the Retrospective Model, which provides a historical view of "Traffic at Risk" considering any ongoing failures at the time of the auto-discovered snapshot. This model is mainly used for mapping shared risk resource groups (SRGs) and their failure trends as well as verifying that outages in the network are accurately represented in the simulations. We’ve built a hierarchical SRG structure mapping any shared risks across all components such as links and nodes all the way from the fiber, DWDM, IP, and logical overlays.
SECOND is the Reference Model, which models the network in a fully operational state and is used to do "what-if" scenarios with regards to topology or metric changes, the addition of new devices, and simulating impacts of planned maintenances and other events.
THIRD is the Forward-Looking Model, which is essentially a copy of the reference model, but it includes all committed augmentations to take that into account when adding new capacity to the network (i.e., combining the 2nd model with known upcoming projects).
Like this Article?
Subscribe to ISE magazine and start receiving your FREE monthly copy today!
Utilizing these 3 methodologies, we can immediately identify where new hotspots have emerged should we have failures — measured in the form of "Traffic at Risk" per time period, device, network role, SRG, and/or region. This informs us where we need to build ahead of time, thereby preventing slow speeds or even the dreaded downtime that we all despise as end users.
Whether it is building to meet ever-increasing demand for bandwidth or trying to beat a potential link failure to the punch, an Internet backbone provider’s work is never finished. This is the price we pay for consumer and enterprise users to have what we want: for the Internet that connects us all, everywhere around the world, and to simply work when we need it.
About the Author


