WiFi Traffic Doubling Every 3 Years —
Given the current state of radio-spectrum use, regulators, academic institutions, civil society, and application providers — all have increasing interest in WiFi’s efficiency. With research showing that WiFi traffic has steadily increased in the last few months and is poised to double every 3 years, demand is pushing beyond the limits of today’s WiFi networks.
Hence, we conclude that the recent FCC 6GHz WiFi-spectrum allocation is already necessary for North America to keep pace with the expected quality of experience of video entertainment, remote work, telehealth, distance learning, and more.
WiFi spectrum use is rapidly approaching an inflection point where demand for in-home bandwidth exceeds demand for to-home bandwidth. This fact challenges the service providers’ infrastructure-investment justification regarding Fiber-to-the-Home because the culprit behind subscriber-performance problems is the WiFi spectrum-allocation limitations.
WiFi Research Takeaways
We leverage the data that we gather globally from Internet-access links, which are processed by our systems and used by our customers: 40 tier-1 ISPs representing approximately 100 million subscriber homes. The data largely emanates from access networks — both broadband to the home and WiFi in the home.
Our analysis concludes that to avoid degradation of QoS, the 6GHz spectrum in North America is already necessary, with Europe’s similar need trailing North America by 6 to 12 months in terms of traffic, congestion levels, and other factors.
It is important to note that the pandemic was in full progress at the end of May last year, so the bias of the initial large increase in early-pandemic Internet use is not included.
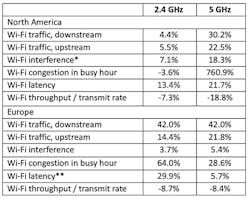
Figure 1 shows the clear shift from 2.4GHz to 5GHz usage in North America and also illustrates the state of WiFi in Europe. In North America, while 2.4GHz band use still increases, 5GHz band use growth is much more rapid in both uplink and downlink, and congestion and latency also increase. European data tells a slightly different story; there is definite growth in the 5GHz band, but expansion also continues in the lower band.
Figure 1. Annualized Percent Change in WiFi Data.
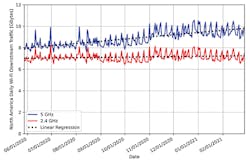
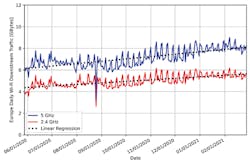
Figure 2 and Figure 3 represent WiFi traffic for 2.4GHz and 5GHz bands in North America and Europe. These graphs average daily traffic over the recorded period and also show a linear-regression fit. While the 5GHz band grows more rapidly in North America than the 2.4GHz band, the increased usage is closer for these 2 bands in Europe. With that said, both continents show rising WiFi usage. The key observation is, at this growth rate, WiFi traffic doubles every 3 years.
Figure 2. WiFi traffic for 2.4 GHz and 5GHz bands in North America.
Figure 3. WiFi traffic for 2.4 GHz and 5GHz bands in Europe.
Additional findings show several interesting conclusions about WiFi usage:
1. LATENCY: The reported Latency measures show delay from the WiFi router to the device and back. In both North America and Europe, latency degrades over time as traffic increases. In North America, the 2.4GHz band experiences less latency (13%) than in Europe (30%). North America experiences more latency on the 5GHz band (22%) compared to Europe (6%).
2. INTERFERENCE: This data measures signal collisions between different WiFi routers, and it grows with the number of WiFi-connected devices and housing density. Notable findings show that in Europe, users can use their channels only three quarters of the time during busy hours, usually evenings. Thus, when interference and traffic are correlated, with annual traffic growth >30%, interference should grow at roughly the same rate. As a result, with an increase of traffic ~30% next year, interference could be over 40%. This means that when a user attempts to connect, they will experience failures or delays 50% of the time.
InvisiLight® Solution for Deploying Fiber
April 2, 2022Go to Market Faster. Speed up Network Deployment
April 2, 2022Episode 10: Fiber Optic Closure Specs Explained…
April 1, 2022Food for Thought from Our 2022 ICT Visionaries
April 1, 20223. CONGESTION: WiFi congestion grows nonlinearly as WiFi traffic grows in North America and Europe. In North America, congestion in the 5GHz band is growing rapidly, which is not the case (currently) in Europe. The data predicts Europe will exhibit the same congestion difficulty approximately 6 to 12 months later.
Spectrum Needs Score (SNS)
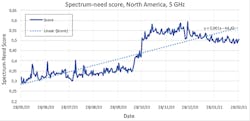
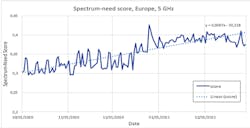
The Dynamic Spectrum Alliance (DSA, http://dynamicspectrumalliance.org/) is a non-profit organization that advocates laws, regulations, and economic best practices, that support more efficient spectrum use, foster innovation, and encourage affordable connectivity to all. The DSA requested we formulate a single metric that helps regulators and other stakeholders determine whether additional spectrum is necessary. Whereby, we developed the SNS, which combines measures of traffic volume, latency, interference, and congestion. SNS is a single metric with values between 0 and 1; 0 indicates the best case scenario (no spectrum needed), and 1 indicates that spectrum is an immediate need.
As demonstrated in Figure 4 and Figure 5, WiFi productivity will be negatively impacted in 1 year. For example, the SNS rises 25% to 40% annually. With that said, North America’s recent 6GHz unlicensed-spectrum allocation will help alleviate this problem.
Figure 4. Spectrum-need score for 5GHz in North America.
Figure 5. Spectrum-need score for 5GHz in Europe.
WiFi Readiness
With the SNS rising 25% to 40% annually, the economic impact could be grim. Therefore, regulators, governments, and others in authoritative positions, should take notice. And as WiFi data use increases rapidly, good end-customer QoE will soon be a major challenge in both North America and Europe. What’s more, government officials often consider broadband-infrastructure investment: the data reveals that investment is unwise without consideration of WiFi limitations. More specifically, the investment return upon expenditure for a higher speed to-home pipe is lowered if home devices cannot leverage the increased bandwidth.
WiFi Study Methodology
To collect the data, our software has an agent present in the end customers’ in-home hardware, and our products also collect and process data from other network points. Connection-health information is gathered at least every 15 minutes. Statistical analysis and processing produce histograms or probability distributions of the different network parameters. The systems then anonymize the data for privacy and competitive reasons and aggregate it to provide a holistic broadband and WiFi performance view for each continent.
For this report, we leveraged data from May 28, 2020 to February 28, 2021, for both the 2.4GHz and the 5GHz bands. The 6GHz band was omitted because there is yet very little data available. The individual metrics that were collected include:
- WiFi Traffic: Traffic at each WiFi router, the sum of all stations’ traffic — daily and hourly, in gigabytes (GB).
- WiFi Latency: Average daily round-trip delay (ms) between the WiFi router and all its clients. Interference: Time percentage that a channel is unavailable because other routers (and unassociated stations) occupy that same channel.
- Congestion: The QoE-extrapolated measure of end-customer frustration as a function connection — bandwidth use by stations associated with this router (i.e., how active the router is).
- WiFi Throughput to Transmit Rate Ratio: The router’s available throughput divided by the maximum transmit rate (Modulation Coding Scheme data rate). Interference and congestion decrease this measure and indicate a need for spectrum.
For more information, and to learn more about how the data collection and processing can impact the future of WiFi, spectrum, and broadband, please email [email protected] or visit https://www.assia-inc.com/. You can also follow us on Twitter @assia_inc.

