Latest from 5G/6G & Fixed Wireless Access/Mobile Evolution
The Perfect Union: 5G and Small Cells
Don’t Break Up Their Bliss by Ignoring Small Cell Challenges —
5G promises to support diverse industry use cases with varying demands of service agility, Quality of Service (QoS), and latency requirements. By enabling a fully mobile and connected society, 5G could be the game-changer — not just for personal communication or content delivery, but also for our way of life.
To realize the vast potential of 5G, however, devices need several things:
• an edge data rate of 100 Mbps to each
• latency of less than 10 ms
• seamless handoff between the licensed and unlicensed spectrum
These goals can be collectively achieved using ultra-densification of Radio Access Networks (RAN) with small cells, large unused bandwidth of millimeter-Wave (mmWave), Citizens Broadband Radio Services (CBRS), and advanced technologies such as beamforming. This article provides a further understanding of these
requirements by deep-diving into mmWave small cell deployments, and why they are so critical for a 5G network.
InvisiLight® Solution for Deploying Fiber
April 2, 2022Go to Market Faster. Speed up Network Deployment
April 2, 2022Episode 10: Fiber Optic Closure Specs Explained…
April 1, 2022Food for Thought from Our 2022 ICT Visionaries
April 1, 2022RAN Ultra-Densification
From the Shannon Capacity theorem, it can be derived that throughput per square mile is directly proportional to the third order of the frequency (f^3), implying that mmWave frequencies are better suited for 5G capacity demands. However, it also means that site density will increase to the second order of frequency (f^2), resulting in higher CapEx per square mile. However, everything else being equal, CapEx per bit decreases by a factor of 10 as network migrates from AWS to mmWave.
In this type of RAN deployment, today’s macro-based cell networks will evolve into dense and ultra-dense heterogeneous networks comprised of thousands of small cells. The potential deployment sites will include streetlights, traffic lights, utility poles, and even dustbins.
In mmWave, the typical path length is 500 feet, and the width of the Fresnel zone at its midpoint is around 62 centimeters. Any slight infringement into the Fresnel zones would add an extra 8-10dBm diffraction loss, which is substantial. Sites that are off by a couple of hundred feet (2 to 3 GIS bins in the planning tool) could alter the propagation map significantly. During 2.5GHz deployments, 1dBm or 2dBm error margin was within the standard deviation of the model. That is no longer the case: 1dBm difference can cause a variation of 30 meters in coverage and approximately 2 small cells per square mile.
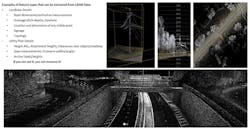
Light Detection and Ranging (LiDAR) is emerging as the technology of choice to include the most accurate features for site selection. Precise details are crucial to determine the most relevant sites for small cell deployments. (See Figure 1.)
Figure 1. LiDAR-based 3D digital survey for site selection.
LiDAR-based 3D digital surveys can be used to generate extremely accurate terrain and obstacle models for use in RF planning. From LiDAR data, features and 3D derivative objects, including poles, trees, terrain models, and buildings, can be extracted with a new level of precision.
Accurate network planning takes the guesswork out of transmitter selection and placement. It also enables CSPs to cut costs by significantly reducing the number and length of physical site-surveys. In many instances it can help CSPs perform upgrades, install new equipment, add capacity, or respond to environmental changes, in a more efficient manner.
Tapping Unused Bandwidth
A relatively unused mmWave spectrum offers excellent opportunities to increase mobile capacity. mmWave (28/39 GHz) has 100-400 MHz, while CBRS (3.5 GHz) has between 10 MHz to 40 MHz free spectrum available. While this spectrum offers an excellent opportunity to increase capacity, little is known about the channel propagation characteristics for mobile access networks in dense urban environments.
Thus, it’s important to be aware of 3 mmwave small cell deployment challenges:
Factor 1: PROPAGATION LOSSES
Penetration loss is a real enemy for millimeter waves, and penetration loss through trees is especially damaging. At very high frequency (VHF) and ultra-high frequency (UHF), 50 meters of tree canopy causes 15dBm to 20dBm penetration loss; whereas in 28 GHz, just 8 meters of tree canopy can lead to a similar loss.
UHF and VHF also take advantage of antenna height gain. Higher mounting heights help reduce the first Fresnel zone blockage by Earth and ground clutter. Whereas at mmWave, the first Fresnel zones width at its center is so narrow that it is never blocked by the Earth’s surface. With propagation distance shorter than 500m, antenna heights of 30 ft. to 40 ft. are enough to support mmWave deployments.
In dense urban areas such as Manhattan, diffraction loss is a more significant challenge. Diffraction losses decrease with proper path clearance. However, even a slight infringement in the transmission path results in an exponential increase in loss. Consider how mmWave cannot penetrate through windows treated with transparent metallic film. This can result in diffraction losses ranging from 40dBm to 60dBm.
Although reflections and diffractions reduce the range of mmWave, they also facilitate non-line-of-sight (NLOS) communication. With a wavelength being so small, all the city obstructions look huge, causing friendly reflections, which increases signal strength. Smooth glass and metal can also result in significant reflection at 28/39 GHz. Accurate planning with 3D terrain and building models can alleviate some of these issues, and can provide better prediction of propagation losses, coverage, and user density, for each small cell site.
Factor 2: MODELING MISSES
Accurate geographic rasters/grids are critical to proper modeling. Planning tools need precise information about tree locations, buildings, rivers, roads, low-density housing, high-density housing, downtown areas with tall buildings, etc. Other inputs include outlines of buildings from aerial photography, as well as 3D street views from LiDAR, including building shape and vegetation details.
Challenges arise when the grids don’t line up. If the grids are off by even a few meters, then your information is useless — garbage in, garbage out!
For example, for 500 small cells planning, using a clutter class map with incorrect assignments is a significant problem. It’s crucial to keep this information up-to-date, especially in urban areas where building clutter height changes overnight. By using LiDAR measurements, clutter height can be accurately determined.
Factor 3: SITE SELECTION DATA
Small cells have their own challenges and limited capabilities due to their coverage range of 500 feet or less. However, in favorable use cases, where there is enough channel bandwidth, small cells can have a major impact.
Finding the right small cell site quickly with minimal cost can expedite network planning and reduce the need for field visits, especially given the current situation of communities still impacted by COVID-19.
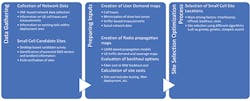
By harvesting the latest and updated information such as aerial imagery, call logs, etc., a 5G inventory planning platform can significantly reduce turnaround times. Leveraging analytics within a site selection process allows engineers to focus on solutions that maximize CapEx and OpEx investments while improving the user-experience.
Analytics-based solutions also accelerate time-to-service not only for CSPs but also for enterprises looking to build-out 5G in factories, ports, and other sites. (See Figure 2.) Consider how user equipment (UE) traffic demand maps with highly accurate GIS details can help calculate accurate site offload potential. This is especially important in dense urban environments where a significant portion of traffic is generated at hotspots. User-demand information and call traces provided by the network can offer the actual level of UE traffic. That information, supplemented with data from accurate geo-locations, can help create a demand map that provides detailed location and volume accuracy.
Figure 2. Example of a sound site selection process supported by analytics.
A Marriage Made in 5G Heaven
When CSPs use proven deployment approaches, sound technology, and large bandwidth opportunities from mmWave, small cells are the key to a faster and seamless 5G network.
At Cyient, we have been modernizing CSPs networks for over 2 decades. Collaborating with a partner that offers customized solutions, proven processes, and extensive equipment knowledge, can help combat the mmWave small cell deployment challenges CSPs must address for future 5G success.
Like this Article?
Subscribe to ISE magazine and start receiving your FREE monthly copy today!
This article is co-authored by Prasad Bhandaru and Sarma Vellanki.
Sarma Vellanki is General Manager of Communications at Cyient, and has more than 20 years of experience in Fiber and Wireless Network plan and design. For more information, please visit www.cyient.com. Twitter: @Cyient


