Latest from Columnist

It’s GIS —
Merriam-Webster defines geospatial as an adjective: consisting of, derived from, or relating to data directly linked to specific geographical locations.
The telecom industry has used site-specific data for decades. So how does this technology solve problems better than traditional data set analysis?
Because when it comes to basics, troubleshooting network issues boils down to What? and Where?
Why is the circuit not working? What is the problem? These can be easy answers or difficult ones. Often, an answer could be as simple as that 23 Ohm ground on the Tip might be causing a problem. The hard part is determining where is it.
Other times Where? is easy and What? is difficult. I know the 911 system is not provisioned properly, but which one of the 448 settings is wrong?
InvisiLight® Solution for Deploying Fiber
April 2, 2022Go to Market Faster. Speed up Network Deployment
April 2, 2022Episode 10: Fiber Optic Closure Specs Explained…
April 1, 2022Food for Thought from Our 2022 ICT Visionaries
April 1, 2022Example: 2018 Outage in Rural Iowa
1. Cell Tower is down
2. On-site — no light in — light out
3. OTDR measures 2KFt to open
4. The CO is 5KFT away, so the What is a cut fiber
5. CO — Light in — Light out
6. OTDR measures 3KFT to open from CO
7. Visual inspection shows 2 road bores at every block for a mile along the cable path
8. All circuits on the southern route are down
9. 2:00 AM — No network engineers available
10. Where do we dig to find the cut fiber?
Geospatial data can answer a question without holding a footage wheel out of a car window or a SWAG based on the odometer. With GIS, 2 OTDR measurements can be correlated to show the location on a map, and a street view illustrates the approximate location. This can be done by the technician on-site with no remote support required.
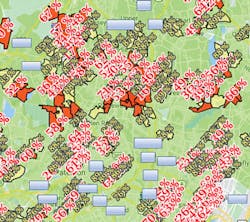
Figure 1. This shows a very small section of the network. The red areas are down. The yellow areas are partially down.
Example: Hurricane Isaias Analysis
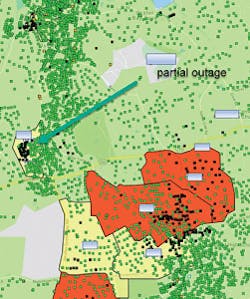
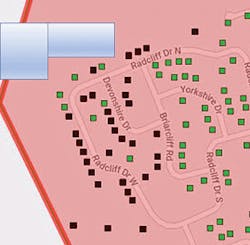
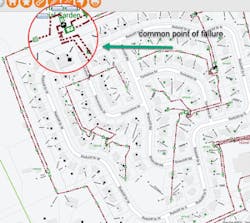
The tactical restoral of a single outage using geospatial data is enough to get excited about. But, what about catastrophic outages over large geographic areas? Consider the next few images that share screen shots from Hurricane Isaias, a destructive hurricane that caused extensive damage across the Caribbean and East Coast of the US in August 2020. (See Figures 1, 2, 3, and 4.)
Figure 2. The yellow color indicated by the green arrow depicts one partial outage being examined.
GIS allows Network Engineers and Architects to evaluate the outages and perform triage without needing a technician to test in the field. Equally, a field technician dispatched on a single subscriber outage can perform the same analysis alone without ever leaving the truck or even calling the NOC. For either user group, the analysis can be done with a few clicks and in less than 5 minutes.
Sure, field techs have been able to complete the analysis above for some time using traditional systems, but the process might take a couple of hours and require 4 different departments coordinating the resolution.
GIS in the Real World
Naturally, my curiosity was piqued about how the concept of geospatial data comes to life for network providers. So, I reached out to interview Faisal Vishram, Senior Technology Architect, TELUS, a Canadian telecom provider with 15.4 million customer connections, and $15 billion in annual revenue. PCMag ranked TELUS the fastest ISP in Canada in 2020.
Check out what Faisal had to say about how their GIS system is making things better for field techs AND customers.
Figure 3. The green squares depict working circuits and the black squares show non-working circuits in the area.
May: TELUS had highly fragmented data sets just 5 years ago. How did you evolve from a laptop application to <1% Churn, 22 servers, 30 applications, and 7,000 users, in just 5 years?
Vishram: We could not have achieved what we have without the determination and innovation from our team and the Open Geospatial Consortium (OGC, https://www.ogc.org/). Their standards and procedures expedited the introduction of new data sets.
Take an example of a wildfire that recently endangered our network. The power company had geospatial data on the locations of the fires that was near real time. However, they did not have the applications to use it properly. We were able to introduce a fire-to-location data set and use it to protect our network within 24 hours. We also generated and shared some reports that helped the power company.
Figure 4. The red circle illustrates the common point of failure for the subscribers involved.
May: How has your coordination with IQGEO been so far?
Vishram: You would be surprised by how little coordination is required. The system is completely OGC-compliant. The entire system is open and uses relatively simple programming languages like Python and JAVA.
May: Were there any challenges with rolling a new application out to Field Technicians?
Vishram: Other than a few pockets, there was very little to no resistance from the field technicians. The new system makes their jobs easier.
We also took feedback from the field technicians and implemented their suggested changes into the system. This helped create a smooth system migration toward the new applications. They trust the new system because they helped design it.
May: The NOC and other back office personnel need access to the same data as the field technicians. What has been their experience?
Vishram: Now, the NOC is able help more technicians than ever before. Field techs have access to the same data in their GUI as the NOC which is helping decrease technician-to-NOC call volume significantly. Also, when the field techs do call, they can all look at the same data simultaneously. This facilitates cross-functional communications and speeds up the restoral process.
Not only did the call volume drop, but duration decreased as well. Calls that used to take 15 minutes now take 1 minute. The decrease in call volume and duration has freed NOC personnel to take on new roles. Remote support for the new in-home security product line is being handled by the same group without adding staff.
May: Can you share some recent GIS applications?
Vishram: TELUS was able to be proactive during the COVID-19 pandemic planning. We were able to locate all the hospitals in our territory and the wireless network elements that serve them. We were then able to automate surveillance on those network elements. Before the permanent cell sites were overloaded, we were ready to provide additional temporary bandwidth using portable cell sites.
May: What was the hardest part of the journey so far?
Vishram: The initial application was a bit challenging. This journey began with a project to replace the software used by the Network Engineers. The old system had to be replaced. Not only was the system old, it was segmented into 800 different regions with no centralized data repository. Receiving buy-in from this group of 1,400 users for a completely new system was difficult. Still, this step was crucial to the success of the overall project because the engineering drawings are now available to 7,000 people.
Adding the twisted copper data sets was difficult, and data accuracy was an issue. However, the field technicians wanted the same data access for copper as they had for fiber optic, so we provided it for them.
Like this Article?
Subscribe to ISE magazine and start receiving your FREE monthly copy today!
May: What was your biggest surprise?
Vishram: How quickly the system has grown. We now have 30 different applications using 354 different data sets. At TELUS, we are constantly finding new ways to utilize this system.
May: What excites you the most going forward?
Vishram: Migrating the application to the cloud. Having everything in one system fundamentally changes the scalability and performance of the system overall.

Vernon May
Vernon May is the Chief Technologist and Founder of Vernon May Solutions. He is an expert in OSP and ISP Operations, and focuses on new technology introduction, from marketing and sales to design enhancement to training to product approval. Along with writing a column for ISE magazine, he also hosts seminars available throughout the country.
For more information, call Vernon at 1.319.238.0285, email: [email protected], visit https://www.vmaysolutions.com/, and follow him on Twitter @Vernonmay13.


