Latest from Home
Dashboards Make You More Analytic-Focused, Efficient, and Profitable —
While telephony has enjoyed its fair share of advancements since coming on the scene in the late 19th Century, the level of technology and the speed of change has never been as rapid as it has been in the last decade. Access to tools that utilize GIS and allow for ease in customization have made it possible for telecom providers, and construction companies, as well as engineering firms, to be more strategic, analytical, efficient, and ultimately more profitable, through highly accurate project management.
Dashboards are one of the more prominent tools that can be leveraged to make this happen for companies around the globe. Today, many engineering companies, municipalities, network owners, material suppliers, and construction companies, either have a Dashboard — and usually more than 1 Dashboard — or are talking about having a Dashboard to help them manage projects and create overall efficiencies within their organization.
Once organizations understand what a Dashboard is, what it can do, and see a level of data and analytics that previously had not been so readily available to them, they are apt to make the investment in Dashboards to enhance their project management.
Dashboard-Driven Change
By now, anyone on the planet who has access to the Internet has likely interacted with a Dashboard. The COVID-19 Dashboard built and maintained by Johns Hopkins University is one of the most widely known and utilized Dashboards in existence at this time. (See Figure 1.) Anyone who accesses this Dashboard can see rates of virus infection at any given time and in any given place using the map on that Dashboard. The data is easy to see and use, and it updates in real-time using geospatial data. Since this Dashboard was built, public health agencies at local, State, and Federal levels are utilizing Dashboards to convey information related to COVID-19 to the public.
Figure 1. The Johns Hopkins COVID-19 Dashboard seen in the image above has been updating in real time since March, 2020.
While it’s easy to adopt an If it’s not broken… mindset, especially when there is an investment of time and resources required, it’s important to consider why companies are electing to make the investment and use Dashboards as a project management tool.
Reasons companies embrace the use of Dashboards include:
• Simplifying complex data
• Viewing important data all in one spot
• Monitoring day-to-day action items and stakeholders
• Tracking historical data and project future milestones
• Monitoring the health of a product, service, team, or project
• Creating personalized views of complex data
Anyone who needs and wants to measure something that involves geographic locations can benefit from using a Dashboard to track data.
InvisiLight® Solution for Deploying Fiber
April 2, 2022Go to Market Faster. Speed up Network Deployment
April 2, 2022Episode 10: Fiber Optic Closure Specs Explained…
April 1, 2022Food for Thought from Our 2022 ICT Visionaries
April 1, 20223 Types of Dashboards for Telecom
When it comes to telecom, there are 3 types of Dashboards that are the most useful:
Type 1. Operational
Type 2. Strategic
Type 3. Analytical
Spoiler Alert: This is usually not a "pick the one you like the most" situation. The various types of Dashboards work together to paint a complete picture that can bring value to different areas of the organization. Each type of Dashboard plays an important role in optimizing strategic, analytics, efficiency, and profitability goals within a single project and/or organization.
Let’s examine how Dashboards can help you meet 3 different types of objectives:
1. Operational Objectives
An operational Dashboard can tell you what’s happening in real time. The Johns Hopkins Dashboard is an example of this.
In our company, we use Dashboard technology on our website to document past projects so that visitors can interact with the data and assess our experience in a very hands-on way before they ever have to reach out and connect with us. (See Figure 2.) When managing a project with many time-sensitive moving parts, telecom providers benefit from having information such as permit expiration and other deadlines all in one place.
Figure 2. Operational Dashboards like the example pictured above are utilized in areas of the organization where day-to-day monitoring is needed.
2. Strategic Objectives
A strategic Dashboard contains less nitty gritty detail and is ideal for members of an organization who need to review high level data and plug it into the broader picture of efficiency and profitability. If decision-makers in an organization need or want to determine where to focus resources for the future, a strategic Dashboard can help present the data in a way that makes high level decision-making more effective. (See Figure 3.)
Figure 3. Strategic Dashboards like the example pictured above are utilized in areas of the organization where high-level monitoring is needed.
3. Analytical Objectives
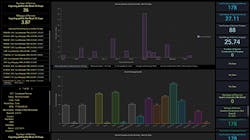
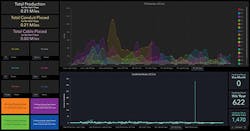
An analytical Dashboard creates an environment that allows users to dig deeper into data. While project productivity is something that can be viewed as high level, using an analytical Dashboard allows a user to dig into crew productivity, supervisor productivity, daily production, yearly production, and more. (See Figure 4.)
Figure 4. Analytical Dashboards like the example pictured above are utilized in areas of the organization where high-level monitoring is needed as well as the ability to "dig in" for deeper detail on data.
Characteristics of an Effective Dashboard
1. Simplifies the complex. Yes, this also made the list of WHY companies invest in a Dashboard in the first place. Think about the saying: "If a tree falls in the forest and no one hears it, does it make a sound?" The same is true for Dashboards: If the complex is not simplified, what was the point of creating the Dashboard in the first place?
2. Draws attention to where it’s needed. There are so many moving parts in a telecom project and it’s easy to get "caught in the weeds" or simply not pay attention to the right things. Since a Dashboard is customized to the needs of the project, the most important data can be placed front and center.
3. Leads vs. Lags. If given the choice of being proactive or reactive on a project, organizations that are "in it to win it" will choose being proactive 100% of the time and a Dashboard provides proactive positioning.
4. Measure key performance indicators (KPIs) clearly, accurately, directly, and without distraction.
5. Custom fit. Every organization determines metrics that work for them. Every organization determines project guidelines that meet their unique needs. Plugging into a template that does not meet the exact needs of a project may save a little on time and resources, but it will be lost on the inability to monitor exactly what the project and organization need to monitor to be successful.
Failure Is Not an Option
Competing for, securing, and delivering on, telecom projects is more competitive than ever. So, whether an organization focuses on engineering, is a municipality, a network owner, a material supplier, or a construction company — speed, safety, accuracy, and cost-effectiveness, are critical. Utilizing a customized, effective Dashboard has quickly moved from a nice-to-have novelty to a can’t-operate-without tool.
Projects are moving faster than ever before. There are more moving parts than ever before. Margins can be thin. Dashboards are the tool that can put companies in a position to make the best possible decisions and be proactive and successful at every turn. They play a big role in the early stages during planning and budgets, and perhaps an even bigger role during the build, and continue all the way through the life cycle of the build through asset management and things like network outages. Even prospecting and marketing efforts can be made more efficient.
Like this Article?
Subscribe to ISE magazine and start receiving your FREE monthly copy today!


