Latest from FTTx/Optical Networks
Choosing a FTTH Network Architecture
Data Center Interconnect
OSP Engineering
Evaluating 4 Access Networks’ Energy Consumption
The Internet, along with the applications and services it enables, have become an essential part of people’s day-to-day personal and working lives, with 4.6 billion people using the Internet in January 2021 alone, according to research from the Digital 2021 Global Overview Report.
Key to accessing the Internet and benefitting from its services are broadband access networks, which are based on different technologies such as DSL, PON or DOCSIS. These run on separate infrastructures, such as the copper (POTS), FTTH, or hybrid fiber coax. Given these options, telecom operators should also consider the power consumption and energy efficiency for these different access technologies before making their network architecture decisions.
Toward that end, it’s important to research how access network technologies perform in terms of overall energy consumption. The 4 we decided to explore were:
- VDSL2-Vectoring
- HFC with DOCSIS 3.0
- FTTH-Point-to-Point (PtP)
- FTTH-GPON
The aim of our research was not to generate energy consumption values for single devices of different manufacturers or normalize values per single port or user. Instead, it was to evaluate the overall energy consumption for each of the 4 access technologies in a ubiquitous rollout.
To do this, we selected a real region, which represents a typical rural-to-urban settlement structure in Germany, where a minimum of 50 Mbit/s was available to every connection within this region. To achieve this, every household, business unit and public building needed to be physically connected to the particular access network, and each network had to fulfil its individual technological parameters to achieve a minimum data rate per subscriber.
The model region consisted of 6 municipalities with a potential subscriber base of 56,700 and 25,311 people. All connection points were geographically referenced to provide the basic data needed for the next step of integrating the known access network information. For every connection point, a set of meta data was available which contained information such as connection point and street cabinet ID, city, street, number of subscribers, cable length, actual download data rate, VDSL2 data rate, and VDSL2-Vectoring data rate.
In combination with data on the energy and power consumption of the individual network element, an overall energy and power consumption could be estimated for each access technology to show how much electrical energy was needed to provide a minimum of 50 Mbit/s for every subscriber in the specified area.
Data-Driven Decisions
The evaluation of the model region and the available information on existing infrastructure led to the respective number of active components for each access technology.
Figure 1 shows how each access technology differs significantly in the number of required active network elements and locations. With 794 fiber nodes and 12 CMTS, the HFC network needs the most active network elements. This is followed by VDSL2 Vectoring with 538 active street cabinets (DSLAMs) and 6central offices. With 36 Point of PoPs (Point of Presence), FTTH has by far the lowest amount of active network elements in different locations.
When we evaluate the power consumption of the access networks, the observation is similar. The power consumption of the HFC and VDSL2 Vectoring access networks is 1.8 to 2.2 times the power of FTTH-PtP and up to approximately 7.5 times more than the FTTH-GPON access network. To be specific, VDSL2 requires the most kilowatts (kW) at 142 kW, while FTTH-GPON needs just 19 kW.
For the Customer Premises Equipment (CPE), we saw slightly different results:
- The HFC network required the most: 456 kW
- The FTTH networks required 341 kW
- The VDSL2 Vectoring required only 253 kW
This is because an additional user device, such as a house amplifier or ONT, is used for the HFC and the FTTH networks. The energy consumption could be reduced by optimizing the CPE, especially in FTTH networks.
If we look at the total power consumption of the access network and CPE, there is little difference between the VDSL2 Vectoring (396 kW) and the FTTH-PtP network (406 kW) results. However, the HFC network consumed far more power at 569 kW, while the FTTH-GPON network required only 360 kW.
The Yearly Impact
The annual energy consumption can be derived from the determined power consumption, as shown in Figure 2. A 4-person household in Germany, where the model region is located, has an average annual energy consumption of 4,200 kWh, according to the Federal Statistical Office. To operate one of these access networks, the energy consumption is equal to between 5%-8% of the total energy consumption of the average 4-person household.
Across the 4 networks, the CO2 emissions range between 1,685 and 2,663 tons per year. Based on the data in Figure 2, the FTTH-GPON network is again the most efficient access network.
Data Rate Analysis
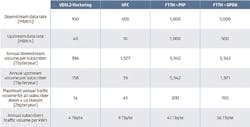
Up until this point, the access technologies were compared under the premise of a minimum data rate of 50 Mbit/s per subscriber. However, this does not consider the individual performance and development capabilities of the different technologies. Normalizing the energy consumption to the maximum transmission volume per year can highlight the capabilities and energetic performance of the different access technologies.
Figure 3 shows that VDSL2 Vectoring, HFC, and FTTH-GPON, provide asymmetrical data rates for the upstream and downstream. These are currently offered data rates in Germany. Figure 3 also shows that the usable data rates of DVSL2 Vectoring and HFC are significantly smaller than the data rates of FTTH technologies, which therefore leads to a much bigger annual transmission volume for FTTH technologies.
Normalizing the respective subscriber’s annual transmission volume to the specific energy consumption of each access technology, the energetic performance becomes clear to see. Figure 3 shows that the energetic performance of the FTTH technologies is far higher than the other technologies.
Meeting Demand
FTTH technologies are based on passive distribution networks between a central office, or PoP, and the subscriber. No active network elements are needed in the distribution network for signal transmission. Increased data rates are achieved by developing the transmission standards and exchange of the active PoP components and CPE.
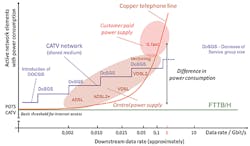
All access technologies require a minimum number of network elements to provide Internet access to the subscriber. Yet, the number of active network elements and network structure develops very differently when the data rate is increased.
Figure 4 shows the development of the active network elements in relation to the data rate for each of the technologies. This illustrates that the copper-based technologies have a significant increase in active network elements.
This increase ends when each customer is directly connected by fiber. FTTH will not need additional active network elements due to the physical advantages that come with a fiber optic distribution network.
FTTx technologies are the only ones that don’t require network adaptions to respond to future demand. FTTx technologies also require the least power when meeting current demand.
Clearly, FTTx networks are the most flexible and energy efficient of the access technologies for the future.
References and Notes
This article summarizes the findings of a study, Energy Consumption of Telecommunication Access Networks, by Prysmian Group. For more information, please email [email protected] or visit http://www.prysmiangroup.com.
For more about research from the Digital 2021 Global Overview Report, visit https://datareportal.com/reports/digital-2021-global-overview-report#:~:text=Internet%3A%204.66%20billion%20people%20around,now%20stands%20at%2059.5%20percent.
Follow Jan on Twitter @PrysmianGroup. Follow Prysmian Group on social media platforms @PrysmianGroup.


