Latest from FTTx/Optical Networks
Part 2 of 4: 3 Key Questions You Must Answer About Link Connectivity —
(Note: For purposes of this article series we are focusing on single mode links.)
Welcome to Part 2 of a 4-part series on getting the most out of your Optical Time Domain Reflectometer (OTDR). Last month we introduced the hardworking OTDR, and discussed why it is such a critical testing tool in construction, acceptance, and troubleshooting, of optical links. We also discussed its complexity (and simplicity). We highlighted 3 key areas to ensure the OTDR is providing optimum information to enable maximum link performance: Connectivity; Optimizing settings for the best trace assessments; Storing results, analyzing results data, and proper documentation/reporting.
In this second article, we explore connectivity. Many OTDR users tend to underestimate the importance of fiber connection quality during testing. It is all too common that bad habits (or lack of good ones) not only hinder accurate testing, but also generate misleading test results.
Understanding All Aspects of Connectivity
Let’s begin by reviewing the scenario we introduced in last month’s article:
Example: Low power launch / High reflectance
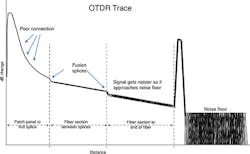
A technician has completed acceptance testing on a pair of fibers in the field. He submits a report with an OTDR trace showing high span loss (dB/km) in the initial section of the fiber and a noisy trace near the fiber end. There is also high reflectance contributing to a large dead zone which masks most of the data from the first span. The result is a poor launch (low power), which also reduces the dynamic range. (See Figure 1.)
Figure 1. Trace with poor launch causes lower signal, noisier trace.
In addition to the issues illustrated by Figure 1, there is another key problem with this trace related to connectivity which we will uncover in this part.
We will use this scenario as an example for discussing how to significantly improve the quality of the trace to gain more accurate and complete information about the link.
When considering connectivity there are 3 key questions to answer. Let’s discuss each one.
Key Question 1
What do you need to visually see and measure?
If operated properly, an OTDR provides a high-quality trace that accurately and fully shows a visual representation "fingerprint" of the link by collecting backscatter level changes (from the fiber and splices) and reflective events (from mated optical connectors).
Ideally, we want to assess the fiber quality and all events from patch-panel to patch-panel. Link events include the loss and reflectance from both patch panel connectors, as splice losses and any mid-span connections. We also need to identify any fiber management issues such as bending related losses.
First, it is important to test with at least 2 wavelengths. This includes the wavelength closest to the range of operation (normally 1310nm or 1550nm) and 1 additional wavelength (preferably higher than the operating wavelength) to identify existing or potential bending losses at higher wavelengths. This way you can locate them hopefully before they affect the operating wavelength.
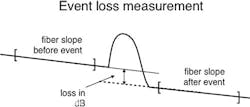
It is also important to ensure we can measure the connection losses at the patch panels. (See Figure 2.) An OTDR can measure events accurately only if it can see the backscatter level before and after the event. This means we need a length of fiber long enough so the OTDR trace can recover from a reflection to backscatter before the panel connector. We call this a launch fiber.
Figure 2. How to measure loss at a connector.
But what about the patch panel connector on the far end? In order to measure the loss of that connection, we also need to see the backscatter signal before and after the panel connector. For this we also need a receive fiber.
The length of launch and receive fibers depends on the OTDR pulse width and the resulting dead zone, which is the distance after an event where the OTDR detector is recovering from the event change.
Key Question 2
How are you connecting to the link?
There are multiple connections involved in testing a link. This question invokes other questions in order to answer the first.
Are you using APC or UPC connectors? What is the connector type(s)? On the link (patch panels)? On the OTDR output? (As you likely know, launch and receive fibers need connectors compatible with your OTDR and with the connectors on the patch panels.)
Are you connecting an OTDR at the far end? Remember: OTDRs do not actually measure loss — they measure changes in backscatter. So, when you are splicing fiber reels together, any backscatter differences will show up in addition to the change in signal level through the event.
The only way to obtain accurate event loss measurements is to test from both ends and average the loss values of each event from A to B side and then from B to A side. [(A>B + B>A)/2]. This means if you are A-side and your test partner is B-side, your launch fiber is B’s receive fiber, and B’s launch fiber is your receive fiber.
InvisiLight® Solution for Deploying Fiber
April 2, 2022Go to Market Faster. Speed up Network Deployment
April 2, 2022Episode 10: Fiber Optic Closure Specs Explained…
April 1, 2022Food for Thought from Our 2022 ICT Visionaries
April 1, 2022Key Question 3
How do you optimize the connections?
Optimizing connectivity for testing is simple in concept, but it can be a challenge in practice. The goal is to have low loss and low reflectance connections at both ends of the link. For this to occur, we need 3 things:
1. An OTDR output port that is pristine (no end-face contamination or damage).
2. A launch fiber with a connector matching the OTDR — also in excellent condition (no contamination or damage).
3. Inspection and cleaning practices in place to ensure #1 and #2 above are achieved.
A. Quality digital inspection probes with the right connector tips and automatic pass/fail grading capability (IEC).
B. Cleaning sticks for bulkheads and connectors (pen-style cleaners).
C. Cleaning tapes for connector launch/receive connector end faces.
D. Wet/dry option cleaning solutions as needed to resolve tougher contamination problems.
The purpose of this article is not to explain inspection and cleaning procedures, so we will assume you already understand best practices for those. But the takeaway here is to ensure everyone who touches the optical connectors follows proper inspection and cleaning protocol AND has the proper tools to do the job.
Assuming all of this is done correctly, the proof is in the trace itself. Does it accurately show the link with the details that we need to accurately and easily analyze the link’s condition and identify any issues?
Evaluating the Validity of a Trace
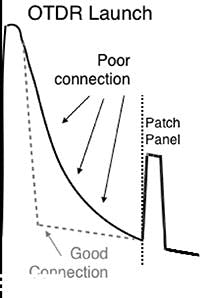
Figure 3. OTDR interface visual. Poor vs. good launch.
Once you have answered all the questions noted above to ensure good connectivity, there is still 1 final question: how do you know when you have a good trace vs. a poor one?
Figure 3 illustrates a launch showing a poor OTDR connection (black) vs. one with a good connection (red). The good launch recovers much quicker to backscatter leaving clear fiber slope prior to the fusion splice. The poor launch (black line) rolls off due to high reflectance and doesn’t recover to backscatter before it arrives at the first connection.
Here are some guidelines on cause and effect, and typical values for loss and reflectance:
1. Poor connections =
A. high reflectance = large dead zone
B. excessive loss at OTDR = low launch level
2. Good connections =
A. mated connector loss (at patch panel) < 0.5dB (average 0.25dB)
B. mated connector reflectance should be…
i. <-45dB (UPC)
ii. <-65dB (APC)
C. OTDR interface: not measurable but use Figure 3 visual as a guide.
If losses are high at interfaces, the signal will be lower and become noisier quicker.
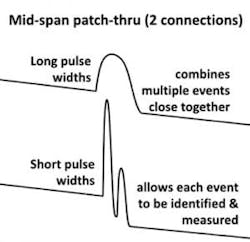
Figure 4. Resolution benefit of using shorter pulse width.
A typical reaction is to test with a longer pulse width to overcome the lower signal (noise). However, there are trade-offs: the longer the pulse width, the larger the dead zone and you have lower resolution. As an example, events closely spaced together might be incorrectly combined as one event using a longer pulse width, where you might be able to see both using a shorter pulse width. Finding the culprit (i.e., which of 2 closely spaced connectors at a patch-through is bad) can be difficult if events in the trace are "hidden" by other events. This is illustrated in Figure 4.
AS A BEST PRACTICE: OTDR traces should utilize the shortest pulse width possible while still allowing you to shoot the entire link with relatively clean trace at the far end where the signal is weakest.
Referring back to what we stated earlier about how to improve traces significantly, we can optimize this trace by:
1. Adding launch and receive fibers with enough length to enable patch-panel connections to be measured at both ends.
2. Inspecting and cleaning all connections between the OTDR and patch panel (OTDR output, launch fiber connection to OTDR, launch fiber connection to patch panel, patch panel connector (bulkhead)).
3. Try testing the link with the OTDR at different pulse widths to identify the shortest pulse that can test to the end with a fairly clean signal. Once the optimum pulse is established, perform acceptance testing at that pulse for all fibers on the same span.
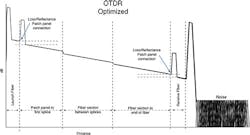
Figure 5 shows the new trace after launch, receive fiber, and other adjustments were made.
Figure 5. Optimized OTDR Trace.
[toggle title=”Did You Know?” load=”hide”]Factoids About OTDR Data Sheets
1. They specify dead zone only at the shortest pulse width.
2. They specify dynamic range only at the longest pulse width. [/toggle]
[toggle title=”Connecting All the Dots” load=”hide”]While OTDRs are one of the most powerful optical tools, their inherent complexity that makes them powerful can also make them challenging to use. This is especially true for novice or untrained OTDR users.
Even though automated schematic functions are now available, they only make interpreting non-complex results a bit simpler. There are no shortcuts for OTDR setup in terms of getting a good connection from the OTDR into the link. The key is in inspection and cleaning of all optical interfaces; and in using compatible and quality launch/receive fibers.
Having an experienced OTDR operator and other trained crews is another critical piece of this process. Even excellent tools can only take us so far — having skilled technicians who know how to identify problems and how to resolve them quickly so that testing can proceed is what keeps projects on time and within budget.
Advanced OTDR training in acceptance testing, trace analysis and troubleshooting is imperative for developing more refined OTDR skill levels. These skills are critical to keep today’s lightning-speed networks operating smoothly, customers happy, and budgets intact.[/toggle]
[toggle title=”Inspection and Cleaning Myths” load=”hide”]We spend a lot of time in the field and we hear a lot of incorrect assumptions about proper inspection and cleaning techniques. Let’s discuss a few common myths about fiber patch panels.
MYTH #1. Patch cord connectors are clean out of the bag and can be connected without inspecting first.
TRUTH: This is false. Patch cords are capped from the factory and sealed in bags.
Not only do "dust" caps not protect the connector end face from dust, they are often a source of contamination. Their primary purpose is to protect the end face of the connector from physical damage, not dust.
MYTH #2. Cleaning is really all that’s needed. I don’t need to inspect if I always clean. Then it must be clean right?
TRUTH: No. In fact, cleaning is needed only IF the end face is contaminated. If you inspect it and it is already clean, then leave it alone. It is possible to add contamination from your cleaning device. Repurposing a cliché: If it ain’t broke, don’t fix it.
Bottom line: The first thing AND last thing you should do prior to mating 2 connections is to inspect both. Cleaning is performed only as needed based on the inspection results. Sometimes multiple levels of cleaning are needed to remove more stubborn forms of dirt or debris.
MYTH #3. I cleaned the patch cord side. I don’t need to clean the bulkhead connector, right?
TRUTH: Wrong. Both connector surfaces must be pristine to ensure low loss and low reflectance. The connector on the back of a bulkhead panel is just as important to inspect and clean as the front side. If you have ever seen the infamous "coffee ring" on a connector end face, that is the result of a clean connector having been mated to a contaminated one. The title stuck because the appearance looks like a coffee ring on a table.
MYTH #4. Don’t clean the optical port on the OTDR. You might damage it.
TRUTH: Wrong again. If you do not inspect and clean the OTDR port, you will not only have poor connectivity, but you will damage the connector ferrule in the OTDR. [/toggle]
Like this Article?
Subscribe to ISE magazine and start receiving your FREE monthly copy today!
Co-Authored with Carla Yount
Carla Yount is Co-Founder of Fiber Insight (Fi), and holds a master’s degree in information technology/software engineering. In addition to the usual financial and operational roles of her position, she is also sometimes the "B side" technician for Fi’s advanced testing projects. For more information, please email [email protected] or visit http://www.fiberinsight.com. Follow Fiber Insight on Twitter @fiberinsight.


